Report of the Sec. of the Interior under Sec. 7 of Public Law 100-443 on the Presence or Absence of Significant Thermal Features Within Crater Lake National Park, 1992
III. Conclusions Regarding Significance of the Hydrothermal Features of Crater Lake
B. Hydrothermal Research in Crater Lake
by U. S. Geological Survey
Review of studies concerning the presence of
thermal water inflows into Crater Lake
by
Manuel Nathenson
U.S. Geological Survey
INTRODUCTION
The purpose of this section is to review available research that is relevant to the question of existence and significance of inflow of thermal water into Crater Lake. The pertinent research topics are:
* the formation of Crater Lake
* hydrologic and chemical balances for the lake as a well-mixed body of water
* thermal and chemical characteristics of springs on the flanks of Mount Mazama
* distributions of dissolved constituents as a function of depth in Crater Lake
* submersible observations in the deep part of the lake
The chemical balance of the lake shows that the inflow of warm, slightly saline fluid is important to explaining the chemical balance of Crater Lake. The data for springs on the flanks of Mount Mazama show what the temperatures and chemistry of non-thermal springs are in order to provide a basis for understanding the anomalies found in the lake. The distributions of dissolved constituents with depth show how the inflow of warm, slightly saline water affects the characteristics of water in the bottom part of the lake. The section on submersible observations describes features such as pools and bacterial mats on the bottom that result from the inflow of warm, slightly saline water and the samples that were obtained from these features.
This review is a summary of a large body of research performed by investigators primarily from Oregon State University, the National Park Service, the U.S. Geological Survey, and other institutions. Details of the various investigations can be found in the original references. Figures have been reproduced from the original studies with minor modifications to labels.
FORMATION OF CRATER LAKE
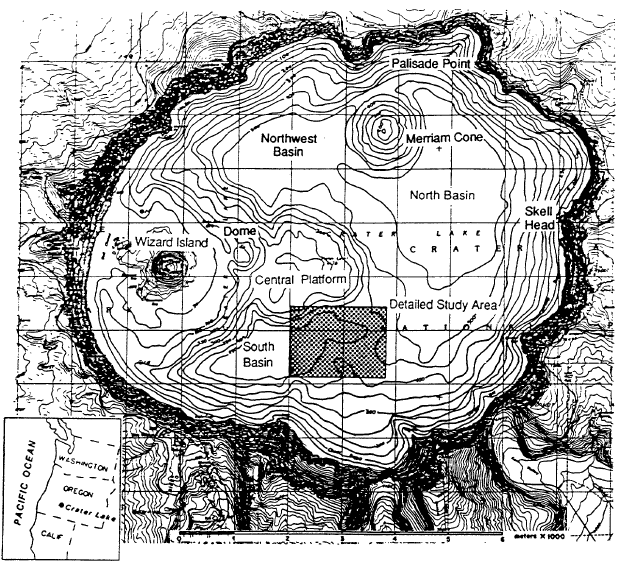
Mount Mazarna is the name for the volcanic mountain in which Crater Lake caldera formed (Bacon and Lanphere, 1990). The oldest lavas of Mount Mazama are approximately 400,000 years old, and continuing volcanic eruptions built the mountain to a summit elevation of approximately 3600 m. At 6850 years before present, a violent eruption destroyed the top of Mount Mazama and created the Crater Lake caldera. The total volume of magma erupted was approximately 50 km3 . After the formation of the caldera, eruptions took place on its floor to form the central platform, Merriam Cone, and Wizard Island (Figure 1). The lake reached nearly its current level before the end of these eruptions. At about 4,000 years before present, a small dome was extruded on the east flank of Wizard Island (Figure 1). Whether these post-caldera eruptions are from the magma chamber related to the climactic eruption or represent a new influx of magma is uncertain. In addition to the lava flows mentioned above, the floor of Crater Lake is comprised of debris from the caldera walls and relatively flat-lying sediments in the deep basins (Barber and Nelson, 1990).
HYDROLOGIC AND CHEMICAL BALANCES OF CRATER LAKE
Crater Lake is 53 km2 in area, 589 m deep at its maximum depth, and has an average depth of 325 m. The average elevation of the lake is 1882 m, and steep caldera walls surrounding it range in elevation from 2050 to 2480 m. Most of the water supply is as direct precipitation because the lake area is 78 % of the total watershed area of 68 km2. The lake has no surface outlet, and water is lost by evaporation and leakage. Phillips (1968) and Redmond (1990) have analyzed precipitation and lake-level data to calculate water balances for Crater Lake (Table 1). Although Redmond (1990) obtained a greater total water supply and a correspondingly larger value for evaporation than Phillips (1968), the two analyses are in reasonable agreement. None of the large springs in the area adjacent to Crater Lake show clear evidence of containing any of the leakage from Crater Lake (Thompson et al., 1990).
| Table 1. Water balance for Crater Lake in units of cm/year (volume per year divided by the lake area). Precipitation is volume per year for area of rain gauge. |
 |
The chemistry of dissolved constituents in Crater Lake water shows that there is an input of constituents in addition to those in precipitation and runoff from the caldera walls. For purposes of analyzing the amounts of major ions dissolved in Crater Lake water, the lake may be considered to be well mixed because vertical and horizontal gradients are small. Based on the water balance, known inputs from precipitation and runoff, and the assumption that the concentrations of dissolved constituents are constant over time, the theoretical major-ion chemical composition of the lake can be calculated. Because the amount of evaporation is an important parameter in this calculation, the calculated concentrations are given in Table 2 for the two values of the fraction of the total water supply lost to evaporation (28 % from Phillips, 1968, and 49 % from Redmond, 1990). For each major dissolved constituent in Table 2, the calculated concentration is substantially less than the measured concentration. This difference is strong evidence of input of thermal water into Crater Lake (Simpson, 1970; Nathenson, 1990b). Although the measured amounts of dissolved constituents in Crater Lake are anomalously high, overall the water is very low in total dissolved solids because of the direct input of large amounts of dilute precipitation.
| Table 2. Concentrations of dissolved constituents (mg/L) in Crater Lake and calculated values based on available water supply (Nathenson, 1990b). |
 |
Analysis of historical data shows that concentrations of dissolved constituents in Crater Lake do not appear to be changing with time, and it is appropriate to do a steady state chemical balance of the lake (Nathenson, 1990b). Using concentrations in the lake, precipitation, and flow from springs on the caldera walls, along with the assumption that inflows and leakage are steady-state, the steady-state rate of inflow of each constituent to the lake has been calculated and summed to obtain a rate of inflow of total dissolved solids. Nathenson (1990b) calculated an inflow of 200,000 mg/s using Phillips’ (1968) value for the leakage from Crater Lake, and Collier et al. (1991) calculated an inflow of 110,000-140,000 mg/s using Redmond’s (1990) value for the leakage. An independent calculation of the current rate of inflow of total dissolved solids was obtained from measurements of the vertical distribution of total dissolved solids in the bottom part of the water column for two periods in 1989 and 1990 (McManus et al., 1991). Because these measurements are at the limit of available precision and because a precise measure of the area of increased dissolved solids is not possible without making many more measurements than is practical, the rate of current inflow calculated by McManus et al. (1991) is quite uncertain. However, the later value, which is 110,000±60,000 mg/s, demonstrates that inflow is still happening today, and that it is approximately equal to the steady-state inflow. Because the water residence time (lake volume divided by rate of leakage) of Crater Lake is about 220 years, a small change in the rate of inflow in the recent past would not be easily detected from the historical data for concentrations of dissolved constituents in Crater Lake.
SPRINGS IN THE VICINITY OF CRATER LAKE
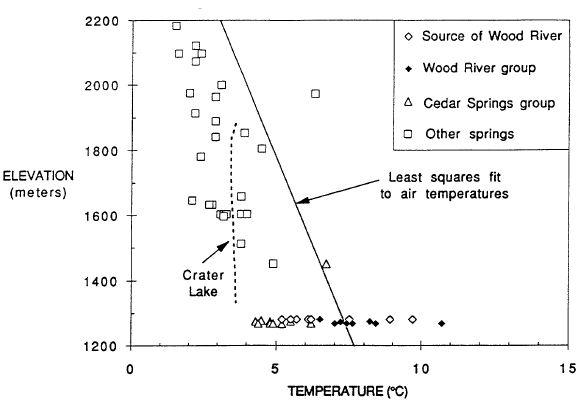
A useful comparison for understanding thermal measurements in Crater Lake is provided by data for springs in the vicinity (Nathenson and Thompson, 1990; Nathenson, 1990a). To determine if a spring is thermal, the temperatures of other springs in the area provide a basis for determining that a spring has an elevated temperature. Figure 2 shows data for spring temperatures in the vicinity of Crater Lake versus elevation. The line shown on the diagram is a least-squares fit to air temperatures from twelve weather stations in southwestern Oregon showing the decreasing air temperatures with elevation. Except for the spring vents that are the source for the Wood River and other springs near the Wood River south of Crater Lake National Park, spring temperatures are generally less than air temperatures, and their variation with elevation is similar to that for air temperatures. Also shown are temperatures for Crater Lake taken at a time when the effects of summer heating in the upper 300 m were minimal. Temperatures in the bottom part of Crater Lake (that are less affected by seasonal variations) are neither particularly hot nor cold compared to spring temperatures at the surface elevation of Crater Lake. Temperatures for the various springs that are the source of the Wood River range from less than air temperature to more than 21C greater than air temperature. Springs of the Wood River group also have temperatures warmer than expected for their altitude. Temperatures for the Cedar Spring group on the other side of the Wood River Valley are not warmer than expected.
Concentrations of dissolved constituents in springs indicate the different processes involved in water/rock reaction. The first analysis in Table 3 is an average of data for springs above the lake and is typical of the process of low-temperature weathering of volcanic glass driven by dissolved carbon dioxide. The resulting water is notably low in dissolved chloride and sulfate, because these constituents are from precipitation, not low temperature weathering of volcanic rock. The second analysis is for a spring on the caldera wall at Chaski Bay slide (not included in average of springs above the lake). In addition to constituents from low-temperature weathering, this water has excess calcium and sulfate that are dissolved from hydrothermal minerals formed during an earlier period of high temperature alteration in the Chaski Bay slide. The chloride concentration in Crater Lake (the third analysis of Table 3) is noticeably elevated compared to either of these low temperature waters. The composition of Crater Lake is also elevated in sulfate compared to most spring water, except for water from the Chaski Bay slide springs.
| Table 3. Concentrations (mg/L) of dissolved constituents in representative springs (Nathenson and Thompson, 1990) and Crater Lake (Nathenson, 1990b). |
 |
The last analysis of Table 3 is for one of the more concentrated springs near the Wood River south of the park. This water is very similar in chemistry to Crater Lake, with elevated chloride and sulfate concentrations. The lower silica in Crater Lake is. caused by diatoms consuming silica and then settling to the floor of the lake when they die. Based on chemistry, one could interpret the water in springs in the vicinity of the Wood River as leakage from Crater Lake; however, the stable isotopes of water (deuterium and oxygen-18) show that these waters are not from Crater Lake. The slightly elevated temperatures of the springs near the Wood River and the similarity of their chemistry to that of Crater Lake water indicate that one component of the mixed waters found in the Wood River Valley has probably undergone the same reactions with rock as the water flowing into Crater Lake and that these reactions took place at some elevated temperature.
Soda springs on Minnehaha Creek northwest of the park boundary represent another type of anomalous water chemistry (Thompson et al., 1990; Nathenson and Thompson, 1990; Mariner et al., 1990). Both springs have elevated chloride concentrations (18 and 4 mg/L), but only one has elevated sulfate. Bicarbonate concentrations are quite high compared to all other springs (2300 and 420 mg/L), and the chemistry of these springs is probably caused by carbon dioxide dissolving in local groundwater and reacting with rock in the near surface. Other soda springs with high amounts of dissolved constituents and little or no anomalous temperature occur in the Cascades, and the source of the carbon dioxide is not well understood. The high amounts of bicarbonate relative to chloride for the soda springs on Minnehaha Creek probably indicates that these springs are unrelated to the process that produces the chemistry of the inflow to Crater Lake and the Wood River springs.
CHARACTERISTICS OF THE WATER COLUMN
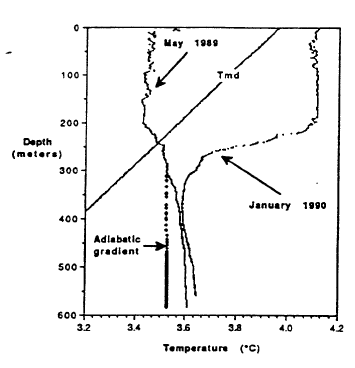
The distribution of temperature with depth in Crater Lake shows that upper 200 m is well mixed and that the deep part of the lake is minimally affected by surface heating and cooling. Figure 3 shows profiles of temperature versus depth from the north basin for January and May (McManus and Collier, 1990). Note that the figure has a range of temperatures from 3.20 to 4.20C. Lake surface temperatures reach a maximum in August (about 150 to 200C). From around mid-August to the beginning of spring, the surface temperature of the lake decreases, and the cooled water produced at the surface sinks and mixes with warmer water in the near surface. As the surface cooling proceeds, the mixed layer becomes progressively deeper. The January 1990 profile shows that surface temperatures have cooled to less than 4.20C and that the vertical mixed zone of uniform temperatures has proceeded to 200 m. Continued cooling for the rest of the winter forces temperatures in the near surface below 3YC. Temperatures in the upper 150 m are less than temperatures shown for the May profile and less than temperatures for the line shown for the maximum density of water as a function of depth (pressure). At a given depth, water at temperatures greater or less than value shown for the line is less dense than water with a temperature on the line shown for temperature of maximum density. In late March, surface temperatures start to increase. This warm surface-water is actually denser than cooler water below it in the upper 150 m, because the lake temperature is less than the temperature of maximum density, and the surface water sinks and mixes with cooler water. The profile for May 1989 shows uniform temperatures to a depth of 200 m, indicating that mixing has been maintained to this depth. Salinity measurements for the upper 200 m of the lake (not shown) confirm that the mixing process is also effective in making the salinity uniform, except for near surface concentration due to evaporation. The two temperature profiles are closest at about 400 m, and this is probably the deepest effect of the seasonal heating and cooling at the surface. Continued warming in the spring and early summer produces warmer, less dense water at the surface of the lake that is stable.
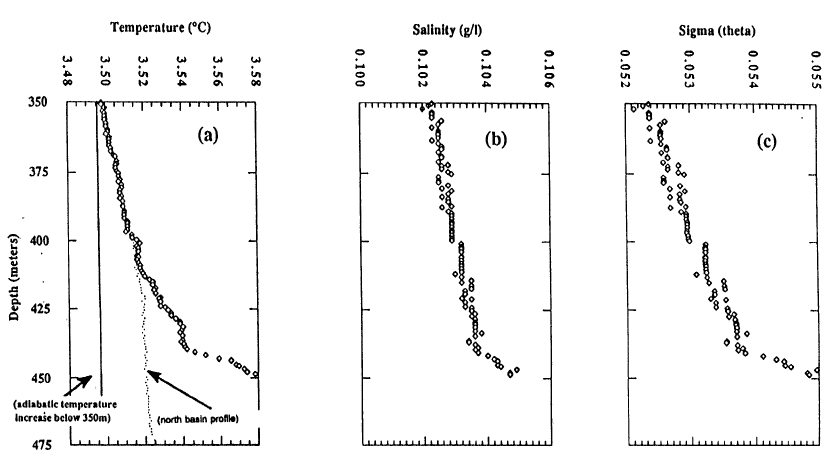
Below 350 m, lake temperatures increase with depth, and this increase requires an active input of thermal energy at depth. Figure 4 shows temperature for the south and north basins of the lake and salinity for the south basin. Note that the temperature scale in this diagram is expanded compared to Figure 3, and the range is only 0.10C. The salinity measurements are at the limit of sensitivity of the instrument used, and that is part of the reason for the step nature of those values. The increase in temperature with depth below 350 m is found throughout the lake. The difference in temperature between the south and north basins reflects a greater input of thermal energy in the south basin. Additional temperature data in McManus et al. (1991) show that warm water flows from the south basin to the north basin. The increase in salinity with depth by itself causes increased density with depth, but the increasing temperature with depth by itself causes decreased density with depth. The stability of the deep part of the water column is shown in the last diagram which is Sigma (theta) = (potential density-1)x1000. The potential density is used to show water column stability by removing the effects of pressure and adiabatic cooling on density. Potential density is the calculated density at each depth as if the water parcel was moved adiabatically to a common reference pressure at the surface. There is a very slight increase in potential density with depth in Figure 4, implying that the deep water column is stable at this time of year.
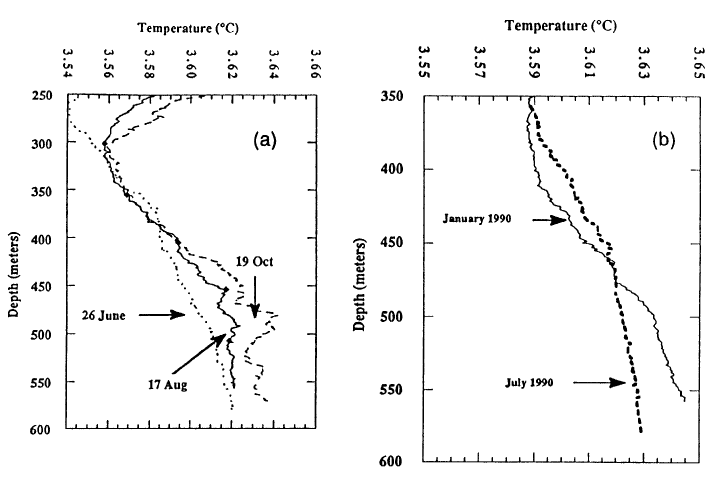
Although the increase in temperature with depth in Crater Lake is very small, it is real and implies that there is high heat flow into the bottom part of the lake (McManus et al., 1991). Temperature-depth profiles taken at three times over a four-month period in 1989 (Figure Sa) show a small but significant increase in temperature in the deep part of the lake as the year proceeds. Given the stable depth stratification of the lake water, this increase must be due to heat addition in the bottom part of the lake. The two profiles in Figure 5b show that warm water in the bottom part of the January 1990 profile has mixed with water above it by July 1990, and the bottom part of the lake has cooled by a small but significant amount. This mixing event probably took place in February 1990 at a time of minimum stability for the water column in the upper part of the lake. Calculation of the rate of heating shows that even though the change in deep lake temperatures is very small, the large size of the lake yields a heating rate of 20 megawatts of thermal energy. Dividing this total heat flow by the 31 km2 area of the deep part of the lake as represented by the 300-m depth contour yields an average heat flow of 650 mW/m2 (milliwatts per square meter). Regional heat flow in the high Cascades of Oregon is 100 mW/m2 (Blackwell et al., 1990). Thus, this estimate of the average heat flow into the bottom of Crater Lake is approximately 6 times the regional value. Heat flow measurements in the sediments of Crater Lake using oceanographic techniques found that 12 out of 62 measurements were higher than 300 mW/m2 , and 7 of those 12 were greater than 550 mW/m2 (Williams and von Herzen, 1983). Although these are conductive heat flows because they are calculated as the product of thermal conductivity times the measured temperature gradient, the high values reflect convection of water either through the sediments or localized in a nearby vent. Thus the source of the heating found from increased bottom-water temperature must be from an inflow of warm water.
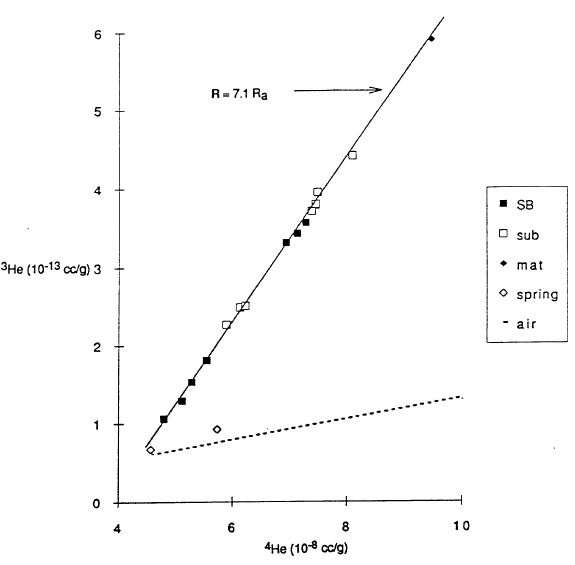
The small change in salinity with depth shown in Figure 4 indicates that major elements measured at usual analytical sensitivities will not easily yield diagnostic information on lake processes. Fortunately, measurements of some other constituents are more readily diagnostic (Collier et al., 1991). For example, helium isotopes provide a tool with much higher analytical sensitivity. Figure 6 shows 3He versus 4He for various samples, and Figure 7 shows 3He versus depth. In the atmosphere, 3He and 4He are found in a fixed ratio shown by the constant slope of the broken line in Figure 6. The two samples for caldera wall springs are close to this line, indicating that the springs are in equilibrium with helium in air, as expected. The other samples in Figure 6 have a constant ratio as shown by their following the solid line, and the slope of this line is diagnostic of the input of helium derived from the mantle. Helium from the mantle that is found near the surface is frequently associated with the degassing of magma. The variation of 3He and 4He along the solid line in Figure 6 reflects mixing of water that was in equilibrium with air with varying amounts of helium with a mantle ratio. Based on this model for sources of helium, the variation with depth of 3He shown in Figure 7 is diagnostic of several lake processes. The upper 200 m of the lake are essentially at a uniform concentration of 3He that reflects equilibrium with the helium in air. This confirms the interpretation of the temperature data in Figure 3 that this upper part of the lake is very well mixed. The lower part of the profiles shows higher concentration in the south basin where higher temperatures are found and lower concentrations in the north basin where lower temperatures are found. The variation with depth shows that the deep-lake mixing process is not as efficient as the near-surface mixing process.
Inefficient deep mixing is confirmed by model calculations for the input of anthropogenic chlorofluorocarbons that show that the time scale for complete mixing of water in the bottom part of the lake with water in the upper part of the lake is about 2 to 3 years (Weiss, 1991). The bottom part of Crater Lake is well oxygenated but slightly deficient compared to the upper lake which is in equilibrium with the atmosphere (McManus et al., 1991). The well oxygenated character also confirms that the lake does mix to total depth, whereas the slight deficiency confirms that this mixing is not as efficient as in the upper lake. Additional confirmation of mixing to total depth comes from the stable isotopes of deuterium and oxygen in water. Evaporation at the lake surface fractionates these isotopes in a characteristic manner, and samples obtained at various depths show that this evaporated water is found throughout water column (Thompson et al., 1990).
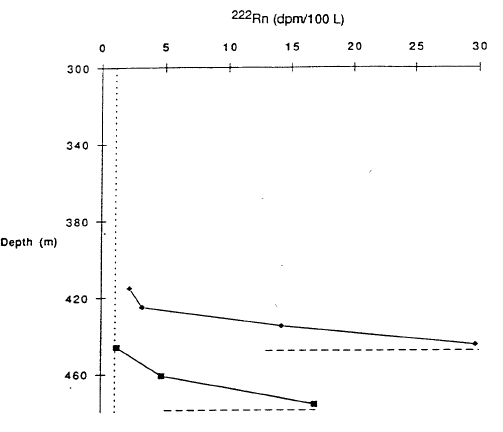
That a fluid must be entering the south basin is demonstrated by the two profiles of 222Rn versus depth in Figure 8 (Collier et al., 1991). The radioactive element 222Rn has a half-life of 3.8 days and is added to water as it circulates through rock. The high values at total depth in Figure 8 show that this deepest water was recently circulating through rock.
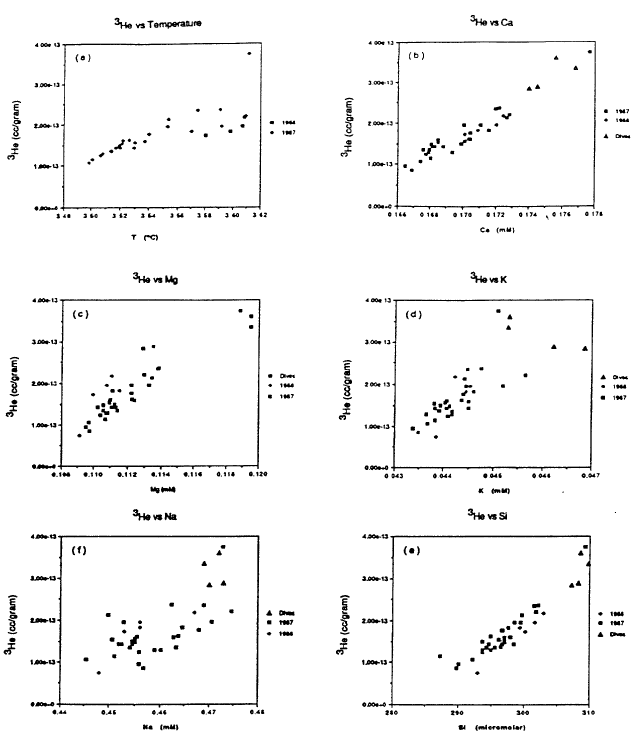
The basic process that governs the properties of the water column in the deep part of the lake is mixing between an inflow of a warm, slightly saline, helium-enriched fluid with lake water that is lower in salinity and helium concentration. The mixing of warm, slightly saline water with lake water is shown by the plots in Figure 9 of temperature and several major dissolved constituents versus 3He for samples of the deep water column in the south basin. The range of variation for temperature and dissolved constituents is quite narrow in Figure 9. Recognizing that some of the scatter is from analytical uncertainty, the data show a linear correlation between each quantity and 3He, which implies that there is a single source fluid that is warmer and contains higher levels of 3He and dissolved constituents. Because of rapid dilution of the inflow at sites of fluid venting, there could be a fluid with values of temperature and dissolved constituents well beyond the range shown in Figure 9.
DEEP-LAKE OBSERVATIONS
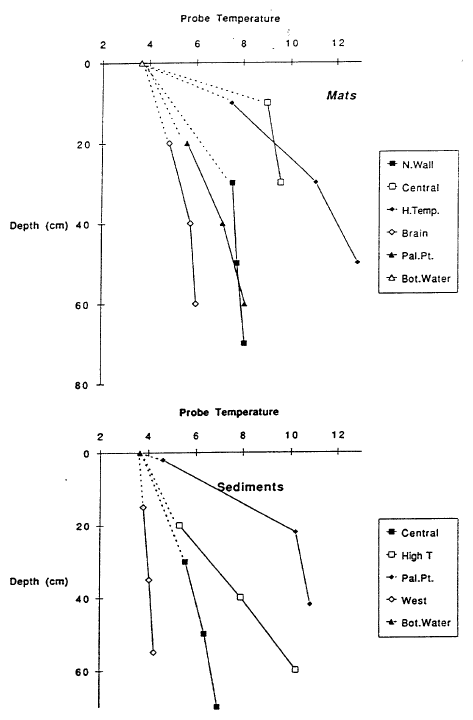
A major objective of submersible operations in Crater Lake was to find sites of inflow and to obtain samples of the warm, slightly saline source fluid. Deep lake observations are given in Collier et al. (1991), which contain photographs of pools and bacterial mats found on the lake floor. No obvious large-scale plume was visually observed; however, some hydrothermal systems found by submersible operations in the ocean also lack visual evidence of plumes. Features observed in the submersible operations in Crater Lake were pools and bacterial mats in the south basin and a mat and pool complex off Palisade Point northeast of Merriam Cone. Maximum temperatures measured in the two major pools studied were 4.50C in Llao’s Bath and 5.50C in the Palisade Point pool. Temperatures in bacterial mats and in sediments were significantly higher than lake temperature (Figure 10) and ranged to 18.90C in a single-point measurement in a mat during dive CD229. The nonlinear character of temperature versus depth in the measurements for some of the mats and sediments (Figure 10) shows that there is movement of warm fluid through the sediments. Fluid samples obtained from gravity cores in the sediments also have nonlinear variations of concentrations of major dissolved constituents with depth, showing that there is movement of more saline water through the sediments (Wheat, 1991). Mat material was found to have iron as the most abundant material and to be enriched in arsenic and manganese.
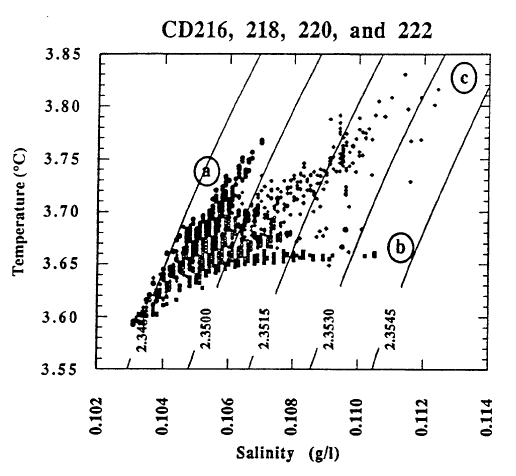
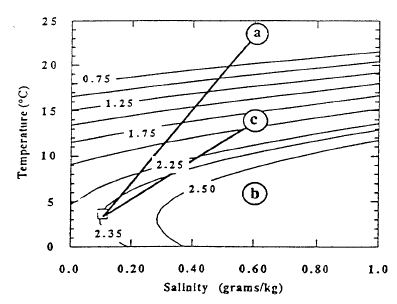
The pools are an ideal environment for collecting samples, but they are lower in temperature than the bacterial mats. The mats appear to be the site of higher temperature venting, but it is difficult to collect samples that are not well mixed with lake water. Thus the observations of higher temperatures in the mats cannot be connected directly with the most concentrated water samples from the pools. Nevertheless, the correlations of temperature and solutes with 3He (Figure 9) demonstrate that there is a source of fluid with a high value of the ratio of temperature to solutes. That there is more than one fluid with differing ratios of temperature to solutes is shown by data for simultaneous measurements of temperature and salinity obtained during several dives of the submersible (Figure 11). The data for higher salinities and temperatures define a field that can be enclosed by projections towards two compositions of differing ratios of temperature to salinity. Based on finding low-temperature, more saline fluid in the pools, it seems likely that the point labeled “b” with a low ratio of temperature to solutes is produced by fluids losing thermal energy in the subsurface before they flow into the pools. The point labeled “a” with a high ratio of temperature to solutes is probably that from the higher-temperature bacterial mats. The submersible measurements define the ratios of temperature to salinity for these two fluids but are too diluted with lake water to define the limiting temperature or concentration. Figure 12 shows the extrapolation of these ratios to the highest salinity fluid sampled. The maximum temperature obtained is about 250C.
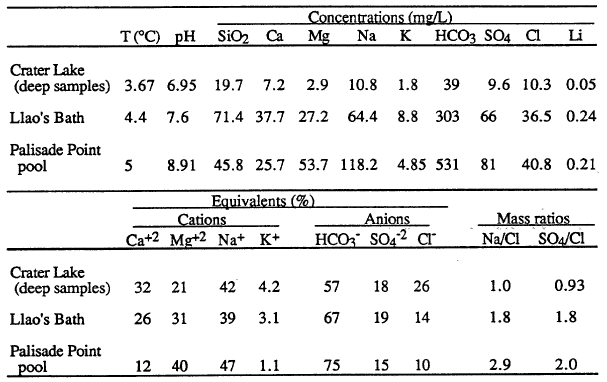
Fluid-chemistry samples from Llao’s Bath and the Palisade Point pool (Table 4) show enrichment in those elements necessary to explain the composition of Crater Lake compared to the available water supply from precipitation and runoff from the caldera walls. The bottom part of the table presents the major-ion chemistry as amounts of ionic charge expressed as per cent of total cations (Ca+2 , Mg+2 , Na+, K+) and anions (HC03-, S0 4-2 , and C1-). The utility of looking at a water analysis in this manner is that it allows the relative proportions of the various dissolved constituents to be compared on a common basis. The equivalent percentages shown in the table for magnesium and chloride, for example, indicate that the waters from the pools are different in relative concentrations from each other and from that in Crater Lake. This difference in relative concentrations can be more easily assessed from the mass ratios in the last two columns of the table. The ratio Na/Cl is 1.0 in the lake, but it is 1.8 and 2.9 in the pools. Assuming that the major determinant of lake chemistry is the concentrated inflows, there are a couple of possibilities to explain this difference. One interpretation is that the major fluid source feeding the lake has not yet been found. A second is that the hydrothermal system at Crater Lake is evolving, and that the chemistry of the water has recently changed. An indication that this might be the case is the discovery of apparently inactive silica spires near Skell Head in the north basin southeast of the Palisade Point pools. The precipitation of silica indicates a higher temperature at these locations than any yet measured on the lake floor.
The stable isotopes of water for samples from Llao’s Bath and the Palisade Point pool show that the source of the water is circulating lake water and that the water has probably not undergone high-temperature (>200°C) reaction with rock (Collier et al., 1991). The samples from Llao’s Bath and the Palisade Point pool have essentially the same concentrations as lake water of the stable isotopes of deuterium and oxygen in water.
| Table 4. Concentrations, equivalents per cents, and mass ratios of dissolved constituents in the deep part of Crater Lake and for pool samples obtained by the submersible (Collier et al., 1991). |
 |
Deuterium values in spring samples in the vicinity of Crater Lake are quite different from lake water, because the deuterium and oxygen isotopes in precipitation are modified by evaporation in the lake. If the water feeding the pools had a deuterium content similar to that of the springs before mixing with lake water, the pool samples would have to mix with 10 to 20 parts of lake water in order for the pool samples to end up with a deuterium content that is indistinguishable from lake water. The carbon-14 isotope content for the sample from Llao’s Bath shows that it can be no more than 50 % lake water. The dissolved oxygen content of the sample for the Palisade Point pool is very low, indicating very little mixture with well oxygenated lake water. Thus, the deuterium contents of the pools are only slightly modified from that for the fluid that feeds the pools, and the source of the fluid in the pools is lake water that has circulated to depth to be heated and react with rock. The oxygen isotopes of lake water are also modified by evaporation of precipitation, but they can undergo additional change if they react with rock at high-temperature. Collier et al. (1991) have calculated the change in oxygen isotopes of water for various ratios of water to rock as a function of temperature. Unless the water to rock ratio is very high, the similarity of the oxygen isotopes of the pool samples and lake water indicates that equilibration temperatures are less than 200’C.
Chemical geothermometer temperatures calculated from major-element concentrations for the pool samples suggest that inflow temperatures may be higher than measured temperatures. These chemical geothermometers are experimental or empirical relations for temperatures determined by the equilibrium between major elements dissolved in water and rock. The calculation of geothermometer temperatures for the composition of lake water is not strictly appropriate, because the lake water is clearly a mixture of a more saline water with water from precipitation and springs on the caldera walls. The pools provide more appropriate samples for geothermometer calculations, but their high magnesium concentration compared to calcium and potassium concentrations indicates caution in using geothermometer temperatures. In most thermal waters, magnesium concentrations are very low, because magnesium preferentially stays in the solid phase when water reacts with volcanic rock at elevated temperatures. Accordingly, in some waters, high magnesium concentrations indicate that the water is equilibrated at low temperature. However, in other cases, high magnesium concentrations are caused by mixing a higher-temperature water with a cold water and subsequent reaction at the mixed temperature. Geothermometer temperatures (chalcedony, Mg-Li, K-Mg) for Llao’s Bath range from 50′ to 900C and for Palisade Point pool from 350 to 700C. Based on the high magnesium concentration, the Mg-corrected Na-K-Ca geothermometer relations of Fournier and Potter (1979) would indicate that the water has equilibrated at the spring temperature (for example the 190C temperature measured in one mat). Na-Li geothermometer temperatures are 1651C for Llao’s Bath and 1 100C for Palisade Point pool (Collier et al., 1991), but these high temperatures are not corroborated by other geothermometers.
An interesting comparison can be made to Swim Warm Springs on the flanks of Mt. Hood, Oregon. The measured spring temperatures range to 260C, and the geothermometer temperatures range from 300 to 1 10’C, also with high magnesium contents (Wollenberg et al., 1979; Mariner et al., 1990). The chemistry of Swim Warm Springs is interpreted to result from a higher temperature water (=1 100C) from near the central vent of the Mount Hood volcano flowing in the subsurface, mixing with cold water, and reequilibrating some of its constituents to the mixing temperature. A similar model could explain the chemistry of waters sampled in the two pools in Crater Lake. Furthermore, a maximum temperature of 130″C was measured at a depth of 1067 m in a well drilled east of the park in the Winema National Forest to a depth of 1423 m (LaFleur, 1990). Based on the comparison to Swim Warm Springs and the high measured temperature in the well, it is reasonable to speculate that there are higher temperatures in the inflow to Crater Lake than those that have been measured.
CONCLUSIONS
Several important conclusions about characteristics of Crater Lake and fluid inflow into the lake have been reached as a result of recent research studies. Submersible operations have measured temperatures of 8, 10, 13, and 19’C in the bacterial mats at the bottom of the lake. Ambient temperatures in the lake are 3.60C, and springs at the surface elevation of the lake range in temperature from about 20 to 50C. Thus the measured mat temperatures are clearly anomalous and meet definitions of thermal springs on land (several definitions are reviewed in Nathenson, 1990a and Mariner et al., 1990). Pools found on the floor of the lake have elevated amounts of the dissolved constituents needed to explain the chemistry of the lake but not quite in the right proportions to account for the present composition of lake water. Temperatures of these pools are elevated compared to the lake temperature, but are not as high as temperatures measured in the bacterial mats. Geothermometer temperatures calculated from analyses of pool samples tend to indicate that the fluid is low-temperature (300 -900C). The presence of 3 He/4He with a mantle signature and significant amounts of chloride, boron, and lithium permit speculation that there is an intermediate-temperature (>900C) water that has been modified by subsequent reaction. The source of the fluid in the pools is lake water that has circulated to depth to be heated and react with rock. Although no obvious venting was visually observed, the nonlinear gradients of temperature and dissolved constituents found in the sediments and bacterial mats clearly indicate flow into the lake, as does the presence of pools with anomalous fluid compositions. The warm, slightly saline water that flows into the lake is found to collect in the bottom part of the lake for much of the year. At the time during the year of minimum water-column stability, the warmer bottom water mixes imperfectly with surface water. Although the greater salinity of the added water tends to make the bottom water stable, the added temperature tends to make it unstable. Without the input of warm water at depth, the mixing properties of the deep lake likely would change, and Crater Lake might no longer mix to total depth. Lake Tahoe depends on winter storms to mix and mixes to total depth only in some years (Goldman and Jassby, 1990). Because of the much smaller average radius of Crater Lake (4.1 km) compared to Lake Tahoe (12.6 kIn) but similar total depths (589 m compared to 501 m), winter storms might not be effective in mixing Crater Lake to total depth.
In summary, the research program at Crater Lake has demonstrated an inflow of thermal water that is important to lake dynamics. The characteristics of this thermal water and its impact on lake dynamics remain imperfectly understood.
REFERENCES CITED
Bacon, C. R., and Lanphere, M. A., 1990, The geologic setting of Crater Lake, Oregon, in Drake, E. T., Larson, G. L., Dymond, J., and Collier, R., eds., Crater Lake, An Ecosystem Study: Pacific Division, American Association for the Advancement of Science, San Francisco, p. 19-27.
Barber, J. H., Jr., and Nelson, C. H., 1990, Sedimentary history of Crater Lake caldera, Oregon, in Drake, E. T., Larson, G. L., Dymond, J., and Collier, R., eds., Crater Lake, An Ecosystem Study: Pacific Division, American Association for the Advancement of Science, San Francisco, p. 29-39.
Blackwell, D. D., Steele, J. L., Frohme, M. K., Murphey, C. F., Priest, G. R., and
Black, G. L., 1990, Heat flow in the Oregon Cascade Range and its correlation with regional gravity, Curie point depths, and geology: Journal of Geophysical Research, v. 95, p. 19,475-19,493.
Collier, R. W., Dymond, Jack, and McManus, James, 1991, Studies of Hydrothermal Processes in Crater Lake, OR: College of Oceanography Report #90-7, Oregon State University, 317p.
Fournier, R. O., and Potter, R. W., II, 1979, Magnesium correction to the Na-K-Ca chemical geothermometer, Geochimica et Cosmochimnica Acta, v. 43, p. 1543-1550.
Goldman, C. R., and Jassby, Alan, 1990, Spring mixing depth as a determinant of annual primary production in lakes, in Tilzer, M. M., and Serruya, Colette, eds., Large Lakes, Ecological Structure and Function. Springer-Verlag, Berlin, p. 125-132.
LaFleur, Joe, 1990, Letter to Jim Larson, National Park Service: California Energy Co., Santa Rosa, California, 5 p.
Mariner, R. H., Presser, T. S., Evans, W. C., and Pringle, M. K. W., 1990, Discharge rates of fluid and heat by thermal springs of the Cascade Range, Washington, Oregon, and northern California: Journal of Geophysical Research, v. 95, p. 19,517-19,531.
McManus, James, and Collier, Robert, 1990, The physical limnology of Crater Lake, OR: Mechanisms for the redistribution of heat and salt in the water column, in Collier, R. W., Dymond, Jack, and McManus, James, Studies of Hydrothermal Processes in Crater Lake, OR. A Report of Field Studies Conducted in 1989 for The National Park Service, Oregon State University, p. A.1- A.30.
McManus, James, Collier, Robert, and Dymond, Jack, 1991, On the physical limnology of Crater Lake, Oregon: Mechanisms for the redistribution of heat and salt in the water column, in Collier, R. W., Dymond, Jack, and McManus, James, 1991, Studies of Hydrothermal Processes in Crater Lake, OR: College of Oceanography Report #90-7, Oregon State University, p. A.1- A.37.
Nathenson, Manuel, 1990a, Temperatures of springs in the vicinity of Crater Lake, Oregon, in relation to air and ground temperatures: U.S. Geological Survey Open-File Report 90-671, 19 p.
Nathenson, Manuel, 1990b, Chemical balance for major elements in water in Crater Lake, Oregon, in Drake, E. T., Larson, G. L., Dymond, J., and Collier, R., eds., Crater Lake, An Ecosystem Study: Pacific Division, American Association for the Advancement of Science, San Francisco, p. 103-114.
Nathenson, Manuel, and Thompson, J. M., 1990, Chemistry of Crater Lake, Oregon, and nearby springs in relation to weathering, in Drake, E. T., Larson, G. L., Dymond, J., and Collier, R., eds., Crater Lake, An Ecosystem Study: Pacific Division, American Association for the Advancement of Science, San Francisco, p. 115-126.
Phillips, K. N., 1968, Hydrology of Crater, East, and Davis Lakes, Oregon: U.S. Geological Survey Water-Supply Paper 1859-E, 60 p.
Redmond, K. T., 1990, Crater Lake climate and lake level variability, in Drake, E. T., Larson, G. L., Dymond, J., and Collier, R., eds., Crater Lake, An Ecosystem
Study: Pacific Division, American Association for the Advancement of Science, San Francisco, p. 127-141.
Simpson, H. J., Jr., 1970, Closed basin lakes as a tool in geochemistry: Ph.D. Thesis, Columbia University, New York, 325 p.
Thompson, J. M., Nathenson, Manuel, and White, L. D., 1990, Chemical and isotopic compositions of waters from Crater Lake, Oregon, and nearby vicinity, in Drake, E. T., Larson, G. L., Dymond, J., and Collier, R., eds., Crater Lake, An Ecosystem Study: Pacific Division, American Association for the Advancement of Science, San Francisco, p. 91-102.
Weiss, R. F., 1991, Deep water renewal rates in Crater Lake deduced from the distribution of anthropogenic chlorofluoromethanes (freons), in Collier, R. W., Dymond, Jack, and McManus, James, 1991, Studies of Hydrothermal Processes in Crater Lake, OR:College of Oceanography Report #90-7, Oregon State University, p. G.1- G.2.
Wheat, C. G., 1991, Fluid circulation and diagenesis in the basement of Crater Lake, Oregon: Pore water constraints, in Collier, R. W., Dymond, Jack, and McManus, James, 1991, Studies of Hydrothermal Processes in Crater Lake, OR: College of Oceanography Report #90-7, Oregon State University, p. F.1- F.31.
Williams, D. L., and Von Herzen, R. P., 1983, On the terrestrial heat flow and physical limnology of Crater Lake, Oregon: Journal of Geophysical Research, v. 88, p. 1094-1104.
Wollenberg, H. A., Bowen, R. E., Bowman, H. R., and Strisower, Beverly, 1979, Geochemical studies of rocks, water, and gases at Mt. Hood, Oregon: Lawrence Berkeley Laboratory Report LBL-7092, 57 p.
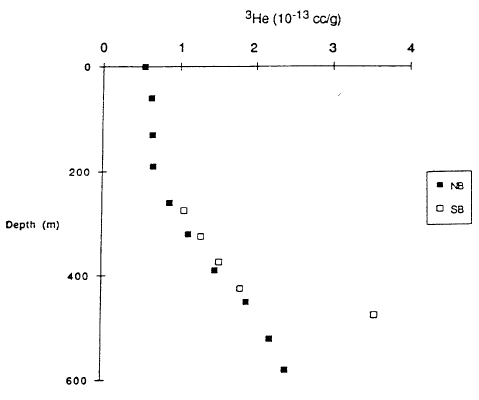 |
| Figure 7. 3He concentration (cubic centimeters at standard temperature and pressure per gram of water) versus depth for north basin (NB) and south basin (SB) of Crater Lake (Coffier et al., 199 1). |
Other pages in this section
*** previous title *** --- *** next title ***

