Cruise Report: R/V Surf Surveyor Cruise S1-00-CL, Mapping the Bathymetry of Crater Lake, Oregon, 2000
Data Transformations
Lake Level Datum
 |
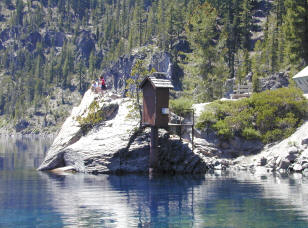
| Figure 8. USGS lake-level gage number 11492200 |
All soundings were measured in meters below lake level, then referenced to elevations above mean sea level so as to construct a digital elevation model (DEM) that was seamless with the existing USGS 10-m DEM of the surrounding land. Each sounding was subtracted from 1883.1 m, the measured elevation of the lake surface during the five days of the mapping (USGS gage no. 11492200 (Fig. 8) referenced to 6100 ft {1859.8 m] above sea level). The lake level was +23.31 (7.11 m) above the gage reference level on the first day of the patch testing and only dropped 0.3 ft (0.09 m) during the five days of mapping. Measured water levels during the mapping were acquired from the watergauge website.
Bathymetry
All bathymetric data were adjusted through Kongsberg Simrad software for (1) transducer draft, (2) static roll, pitch and gyro misalignments, (3) roll at reception, (4) refracted ray path, and (5) beam steering at transducer interface. Post-logging transformations included (1) transformation of navigation from antenna to transducer, (2) correction for positioning to sonar time shifts, (3) lake level, and (4) any unaccounted-for static attitude misalignments.
Backscatter
The Kongsberg Simrad EM1002 provides a backscatter-intensity time series for the bottom insonification period for each of the 111 individual beams. The corrections applied by the shipboard recording system are listed in Table 3.
A set of required backscatter data transformations is performed by specialized software written by the Ocean Mapping Group at the University of New Brunswick. The transformations include conversion of each beam backscatter time series to a horizontal range equivalent, splicing the 111 beam traces together to produce one full slant-range corrected trace, and removal of residual beam-pattern effects. Although the system software corrects for average beam pattern, there are ± 2-dB ripples in the average beam pattern that vary from transducer to transducer that proved difficult to eliminate.
Our processing approach to backscatter was to stack several thousand pings to view the angular variation of received backscatter intensity as a function of beam angle. Inherent in this function is both the transmit and receive sensitivities, as well as the mean angular response of the lake floor. We then invert this function to minimize the beam pattern and angular variations.
Table 3. Corrections applied to each beam for backscatter.
- source power adjustments.
- spherical spreading compensation.
- attenuation compensation (using operator entered 30 dB per km.).
- TVG adjustments.
- designed beam-pattern compensation.
- calculation of insonified area (assuming a flat lake floor at the nadir depth).
- application of a Lambertian model; using flat lake floor equivalent grazing angles) to reduce the dynamic range of the data stored at 8 bit (0= -128dB, 255 = 0 dB).
Kongsberg Simrad uses a variable gain within 15° of vertical to reduce logged dynamic range at nadir and near-nadir. The sidescan data at this stage had a Lambertian response (Urick, 1983) backed out and the beam pattern corrected with respect to the vertical and all receive beams had been roll stabilized. Consequently, corrections have been made for variations in the beam-forming amplifiers but not variations in the individual transducer stave sensitivities of the physical array. Additional transformations were required to produce calibrated backscatter measurements. These include (1) removal of Lambertian model, (2) true lake floor slope correction, (3) refracted ray-path correction, (4) residual beam-pattern correction, and (5) aspherical-spreading corrections.
***previous*** — ***next***

