
Fisheries Investigations in Crater Lake, Oregon, 1937-1940 by Arthur D. Hasler and D. S. Farner
This paper summarizes an investigation on the fishery biology of the rainbow trout (Salmo gairdnerii irideus), and the silver salmon (Oncorhynchus kisutch), at Crater Lake, Oregon, from 1937 to 1940. A preliminary report by Hasler (1938) analyzed the observations of 1937 and gave a brief description of the limnological features.
Methods
A creel census conducted each summer through the cooperation of Paul Herrin, E. Wilcox, the ranger staff, and CCC workers recorded about 90 per cent of the catch by all anglers. This favorable return resulted from the fact that only one trail to the lake was in passable condition and the only boat concession on the lake was at the base of this trail. Some natives of the region may have reached the lake by devious passes and fished from rafts or from shore, but shore fishing has proved to be unfruitful, and fishing by this group is assumed to be less than 10 percent of all angling.
A group of fishes was selected at random from the angler’s creel each day for study of growth and survival of year classes, and to obtain general fishery information. Each fish was weighed and measured, its sex determined, and a few scales removed from below the dorsal fin. The data were analyzed according to procedures introduced by Hile (1941). The observations recorded here on the growth of salmonids serve only to interpret fishery problems and not as a contribution to the techniques of scale analyses.
1 Aided by the National Park Service, CCC, NYA, and the Department of Zoology, University of Wisconsin.
Growth
An analysis of the growth of each year-class (fish originating from the hatch of a particular year) beginning with the stocking of fry and the natural hatches of 1932 is recorded graphically for the trout (Fig. 1) and the silver salmon (Fig. 2). The curves summarize the data presented in Tables 1 and 2. The growth history of each age group was divided into annual increments, and the grand averages of the annual increments used to construct an average growth curve.
When the broken line connecting the calculated lengths of the same year of life is followed (Fig. 1) it will be seen that the first year of growth in each year-class is fairly uniform except for that of 1938 in which it exceeded all others. This last may not be representative because only 19 fish are represented. Perhaps, too, only the faster growing members of the year class were large enough to take the anglers’ lures in early life. Catches of the 1938 class may be expected to smooth out this curve in subsequent years as it appears to have done in the previous year-classes.
The growth of the salmon (Fig. 2) also shows a tendency toward greater lengths in the younger fishes. This too may be because only the larger individuals were caught by angling. The tackle used by the anglers has been very uniform throughout. Lee’s phenomenon also may play a role in explaining the apparent small first-year growth of the older fishes.
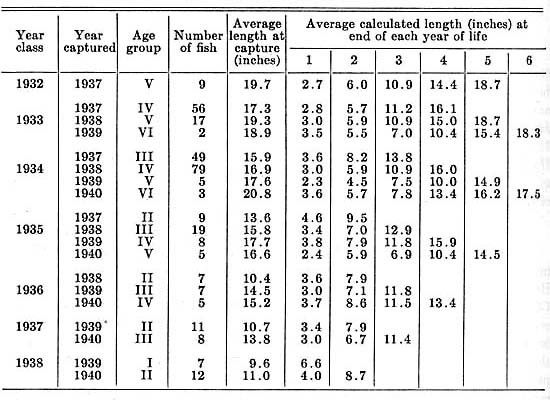 |
| Table 1 – Rainbow Trout – Average Length at Capture and Average Calculated Length by Age Groups, Year-Classes, and Year of Capture |
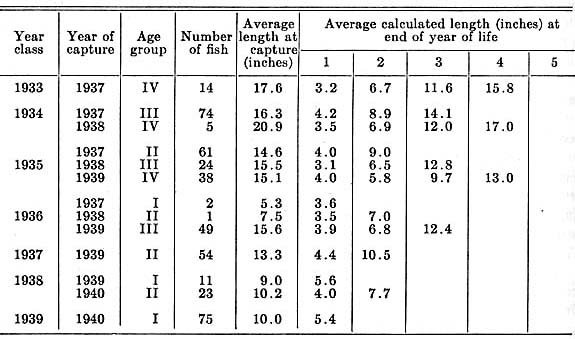
| Table 2 – Silverside Salmon – Average Length at Capture and Average Calculated Length by Age Groups, Year-Classes, and Year of Capture |
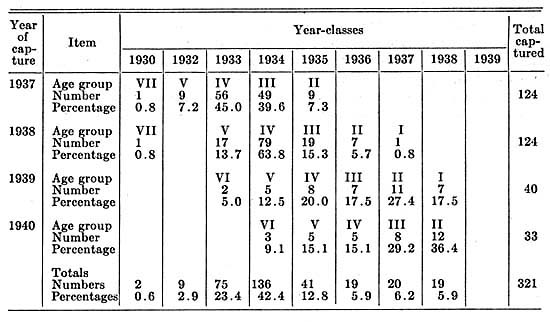
The 1934 year-class of trout exceeded all others in yield, being 42.4 per cent of all captures (Table 3). The 1933 and 1935 year-classes were next in amount (23.4%, 12.8%) whereas the classes of 1936, 1937, and 1938 provided only 5.9, 6.2 and 5.9 per cent of all captures.
 |
|
Table 3 – Rainbow Trout – Representation of Year-Classes in Collections of Different Years |