Water Balance – 03 Water Balance Using Yearly Data

Table 3. Parameter values for yearly water balances for Crater Lake, Oregon, obtained by correlations of yearly change in water level with precipitation data for the 1962-1988 time period. Uncertainties are standard errors. P-values are from t test (two tailed). Average absolute deviation is the sum of the absolute values of the difference between measured and calculated water level divided by the number of years.
comple3


Table 4. Parameter values for yearly water balances for Crater Lake, Oregon, obtained by correlations of yearly change in water level with precipitation data for the 1962-1988 and 1931-1962 time periods. Water-level change as independent variable. Uncertainties are standard errors. P-values are from t test (two tailed) comparing each result for 1931-1962 time period to 1962-1988 time period.
comple4


comple8
Figure 2. Water level for Crater Lake and daily precipitation at Park Headquarters averaged over years with complete records (Water years 1962-64, 1966-72, 1975-77, 1979-85, 1988-89). Water-level data from U.S. Geological Survey (1970, 1976, 1972 – 1979, 1981a & b, 1983), Alexander and others (1987, 1988, 1989), Hubbard and others (1983, 1984, 1986, 1989,1990). Precipitation data from National Oceanic and Atmospheric Administration (1961-89).


comple9
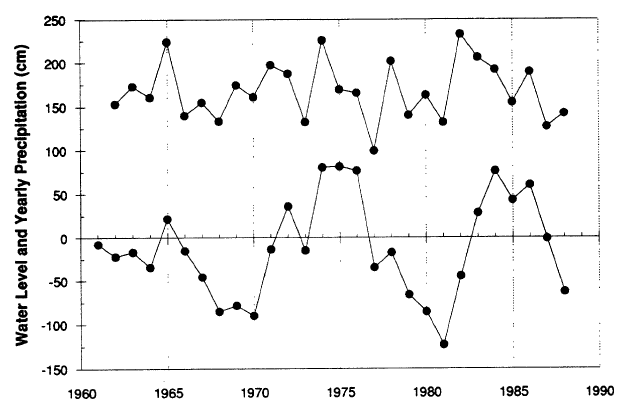
Figure 3. Water level for Crater Lake (above 1882.14 m elevation) and yearly precipitation at Park Headquarters. Water year is Oct 1 to Sep 30.