Water Balance – 08 Figures

comple10
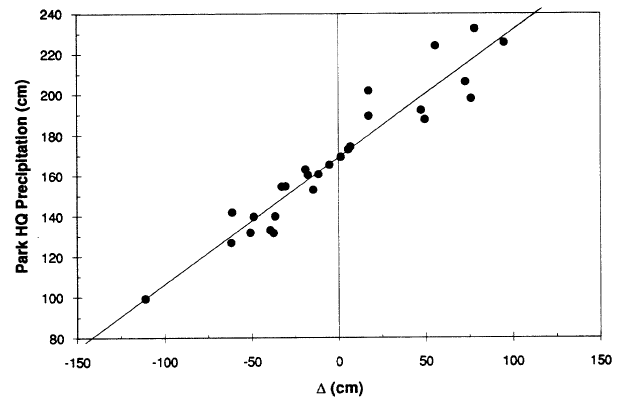
Figure 4. Change in level A from Oct 1 to Oct 1 versus precipitation for period 1962-1988. Correlation line uses precipitation as independent variable.


comple11
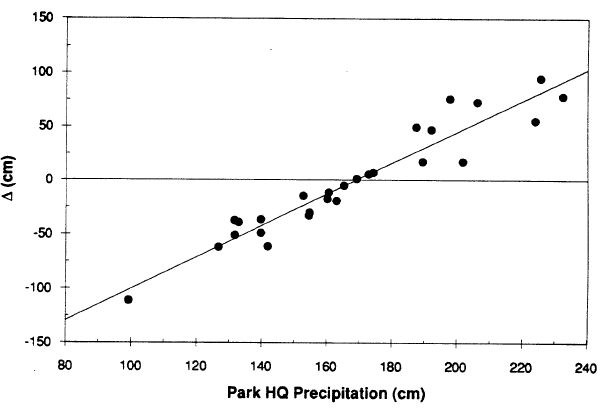
Figure 5. Precipitation versus change in level A from Oct I to Oct 1 for period 1962-1988. Correlation line uses change in level as independent variable.


comple12
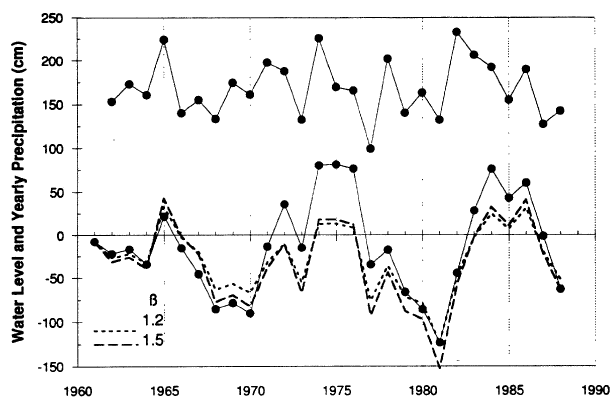
Figure 6. Water level for Crater Lake (above 1882.14 m elevation) and precipitation at Park Headquarters. Water year is Oct 1 to Sep 30. Water levels shown by broken lines calculated using equation (6) from measured precipitation values.


comple13
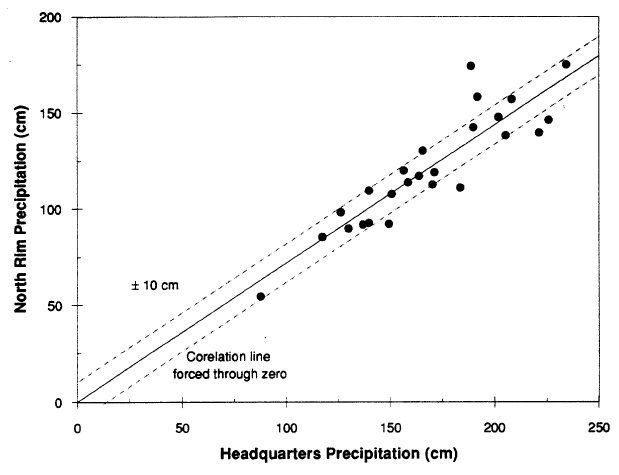
Figure 7. Precipitation at North Rim gage versus that at Park Headquarters for July 1 – Jun 30 water year for 1964-88 time period. Correlation line calculated assuming that line passes though 0. Precipitation data for North Rim gage from National Oceanic and Atmospheric Administration (1966-77) and unpublished records of U.S. Geological Survey.